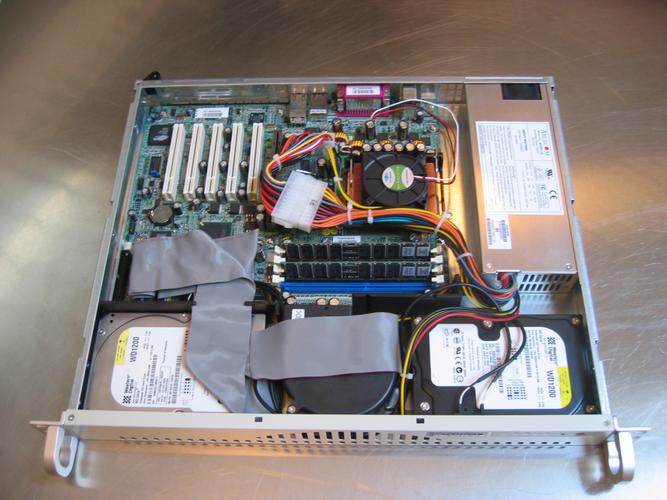
MonkeyBrains.net/~rudy/example Random examples

Here is a fun project idea: monitor the temperature on your motherboard and make pretty graphs! I have been monitoring the temperature on two identical machines over the past year, and now I have some data. Check out my page on CPU fan cooling if you like this page.

Materials:

  • mbmon.tgz - Handy CGI script which makes the graphs below.
  •   Case Cooling  
    Tyan 2098 setup:
    2 drives/2GHz/2GB
    One thousand words.
    Click to enlarge
    Rack login convection based case
    (fanless heatsink)
    Replaced case in same rack with same mother board in January with a supermicro case and a heatsink with a friking mini blower on the CPU

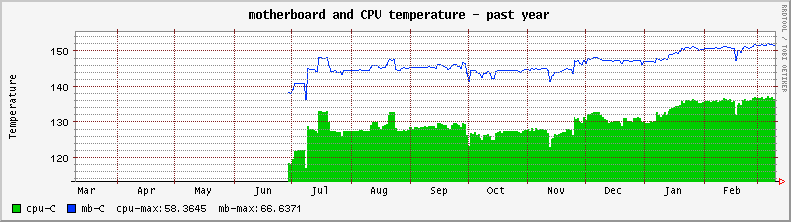
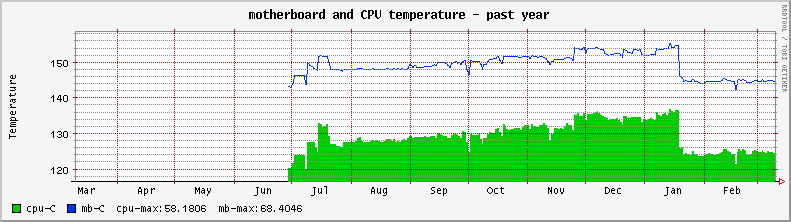
    Note: the general rise in temperature over time is due to more servers being in the data center. CNET colocated their servers 20 feet from MOnkeyBrains.net and the temperature rose. The polar ice caps in the soda pop machine are going to melt on the 5th floor of the data center if any more computers move into the building!

    Note: The little dips you see are days the rack doors were open for half the day.

    Note: The CPU and Motherboard temps may be switched on these graphs.

    Rack logic cases
    (Actuall test servers @ 200 Paul Ave.)
    SuperMicro Case
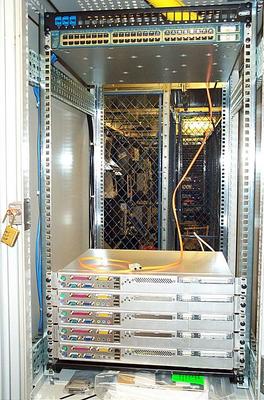
    (One of the above servers got a new case)

    [Yes, I will build and host a server for you for cheap!]
    2 graphs found.

    This data is completely accurate.